TOP FEATURES
Always have a handle on your projects
Here’s a few reasons how…

Visual project breakdown
to intuitively create & manage project components

Zero-click status
to see important info — immediately

Little UI elements
that replace reports & spreadsheets — saving thousands of clicks

Safe-project settings
so only the right people can modify & delete the right things

Built-in best practices
to enforce productivity techniques from Lean, Kanban, TPS & more

Charts and projections
to play what-if scenarios to generate completions dates — in real-time

Project templates
to create new sets of tasks for Lean, Blue Ocean Strategy & JTBD based projects

Cleanliness mechanisms
to keep workspaces neat & clean — so no one gets overwhelmed

Elegant UI themes
4 light & 4 dark ones for users to create their own screen-beauty

Compliance features
to keep data safe & secure, and auditors — happy

Export projects
in whole or parts to Excel to do custom reports — if you wish so

Single to-do list
across all teams and all projects to keep everyone on the same page
Here’s a few screenshots…
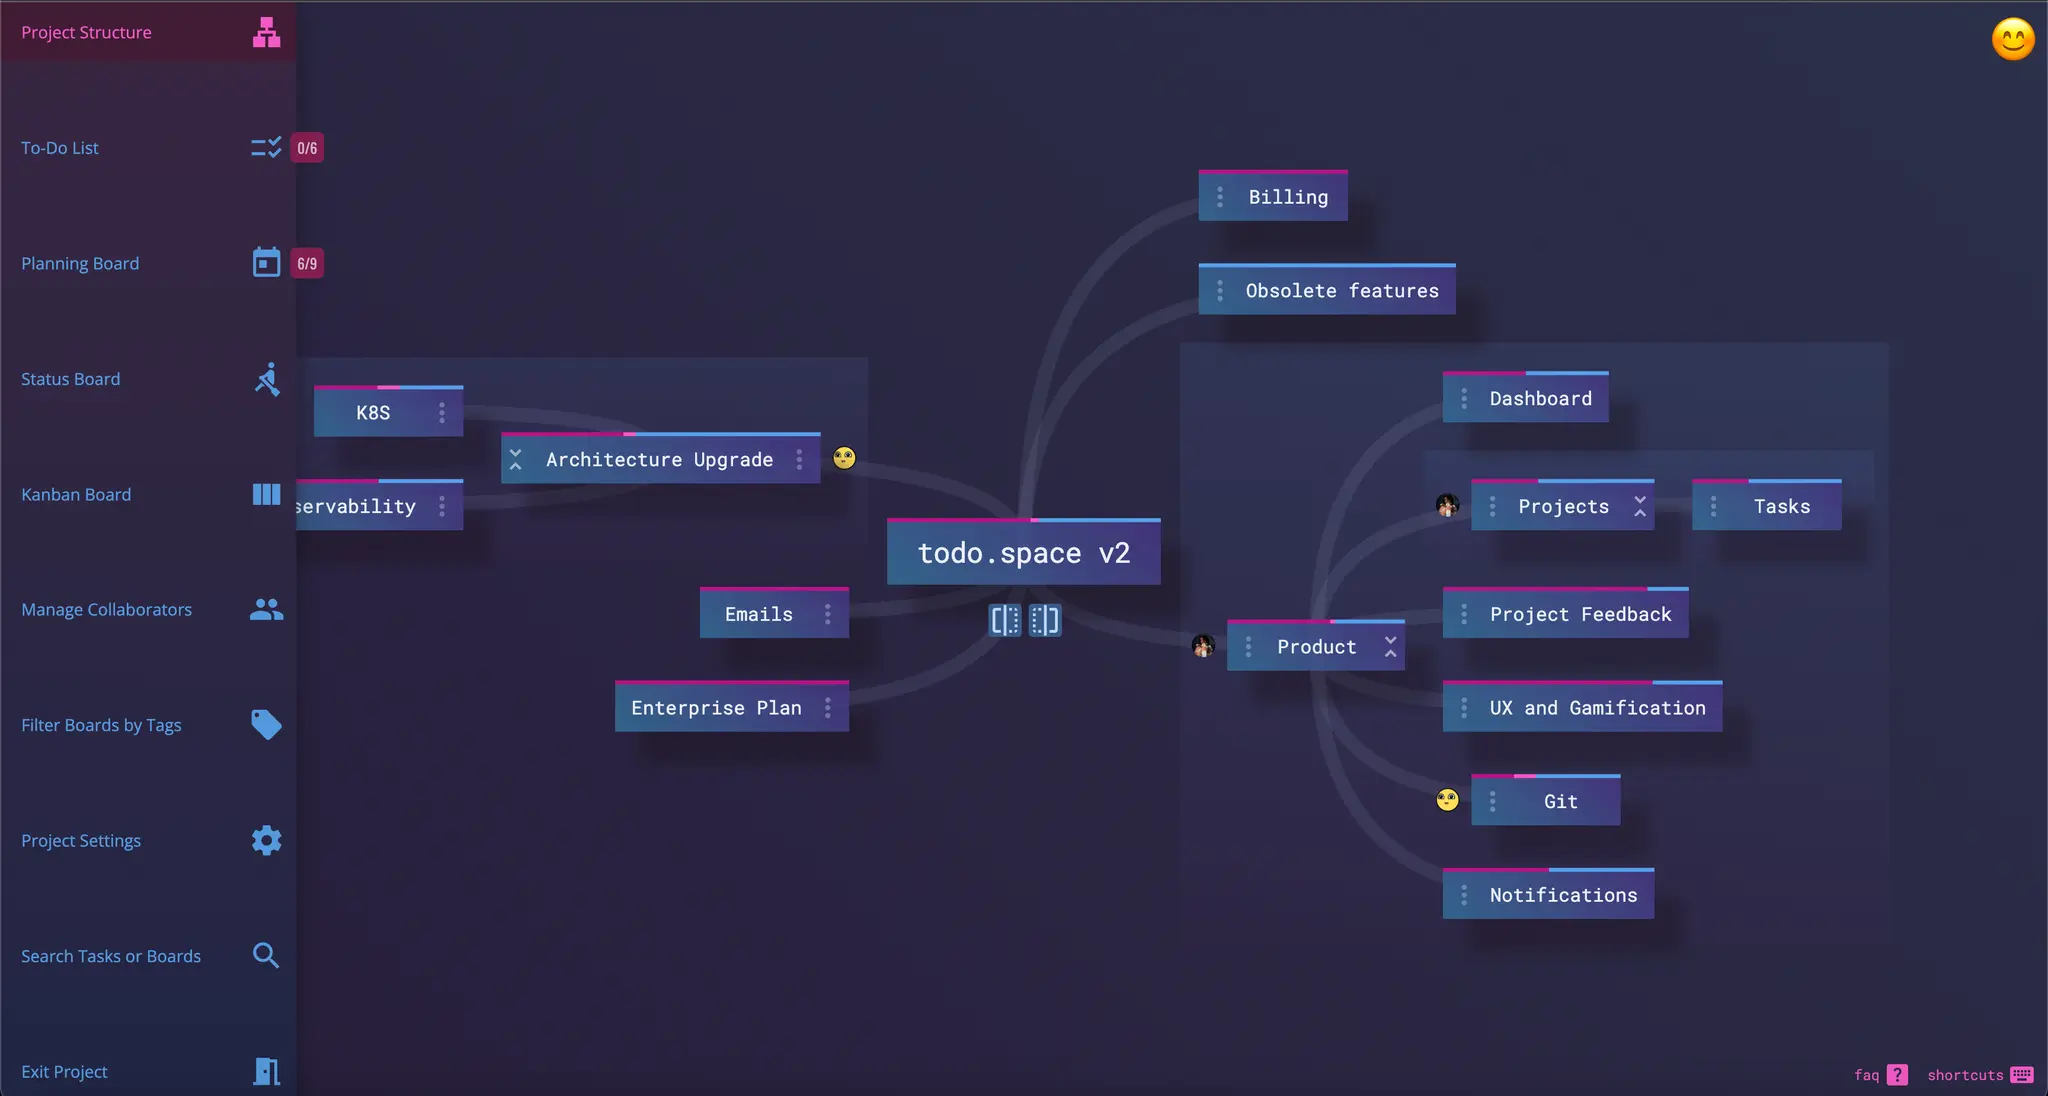
Project Structure View
Project Structure View is a visual and intuitive Work Breakdown Structure (WBS) for hierarchical decomposition of a big project into smaller, manageable components or subprojects — so it's easier to find things, make sense of them — and their status
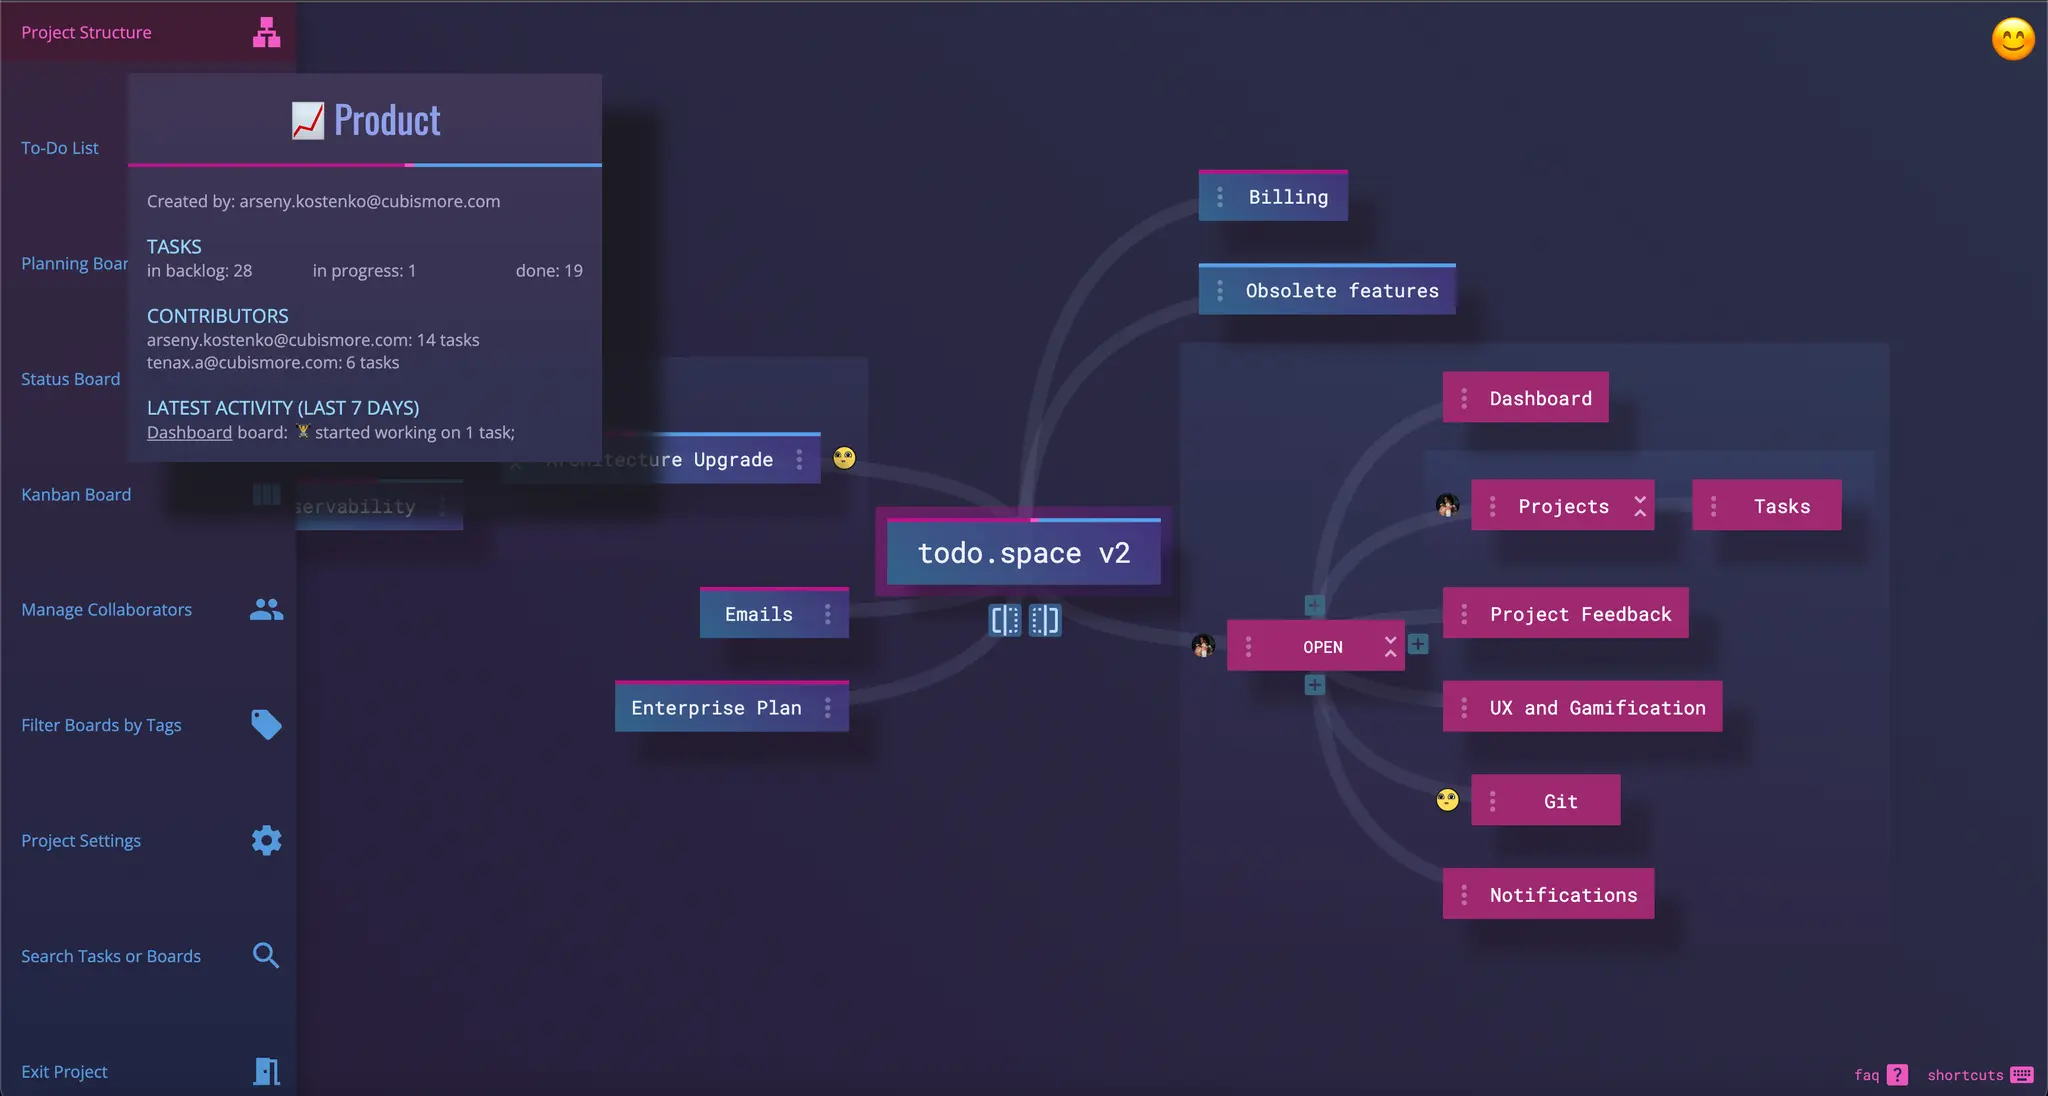
Project Structure View (with Status popup)
Zero-click status popup shows quick facts about a subproject, such as the recent activity, top contributors, task completion stats, whether the backlog is growing and who created this subproject — now you see why project decomposition is important
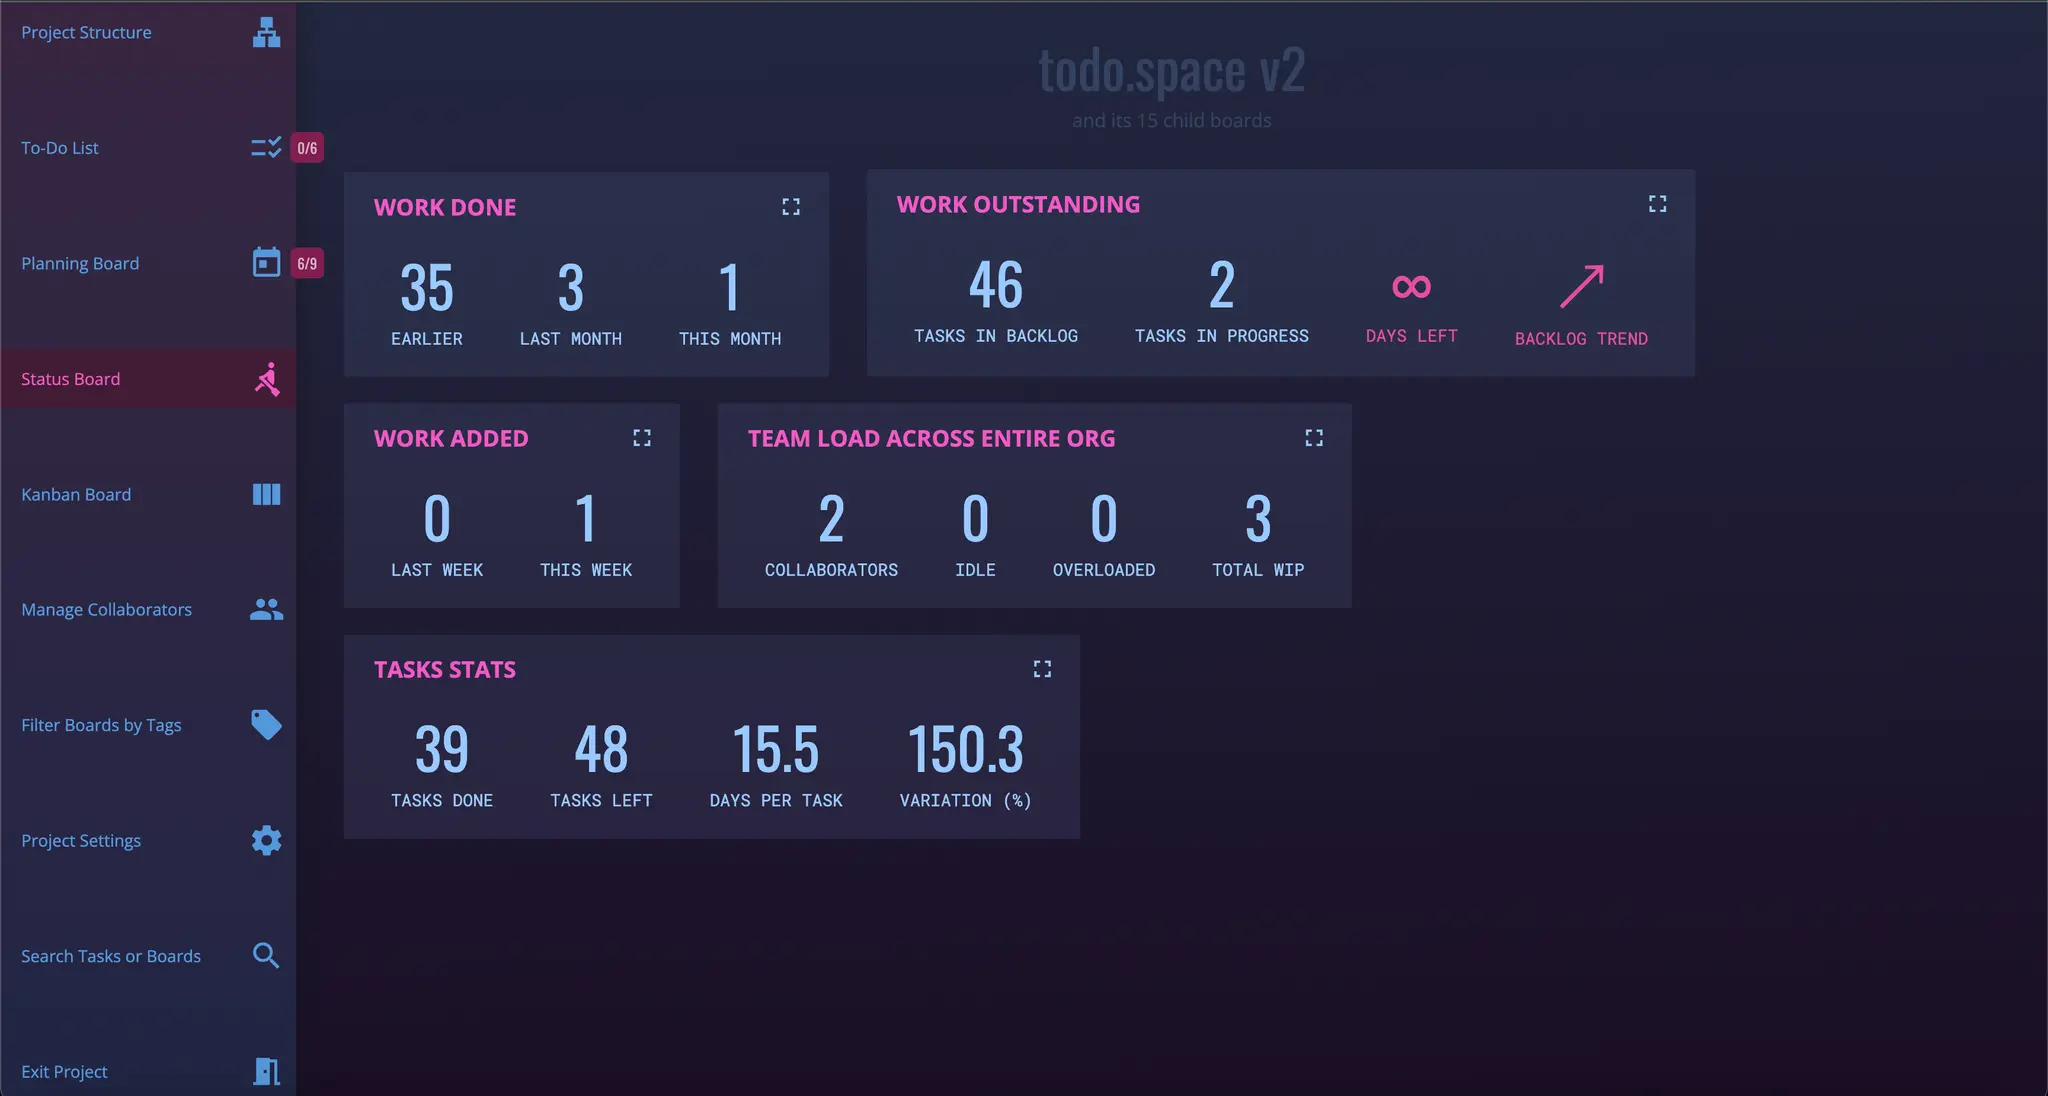
Status Board (all widgets collapsed)
This is where all essential project management questions are answered. In this screenshot, all widgets are collapsed, so only quick facts are shown. But this is already a lot data at your fingertips!
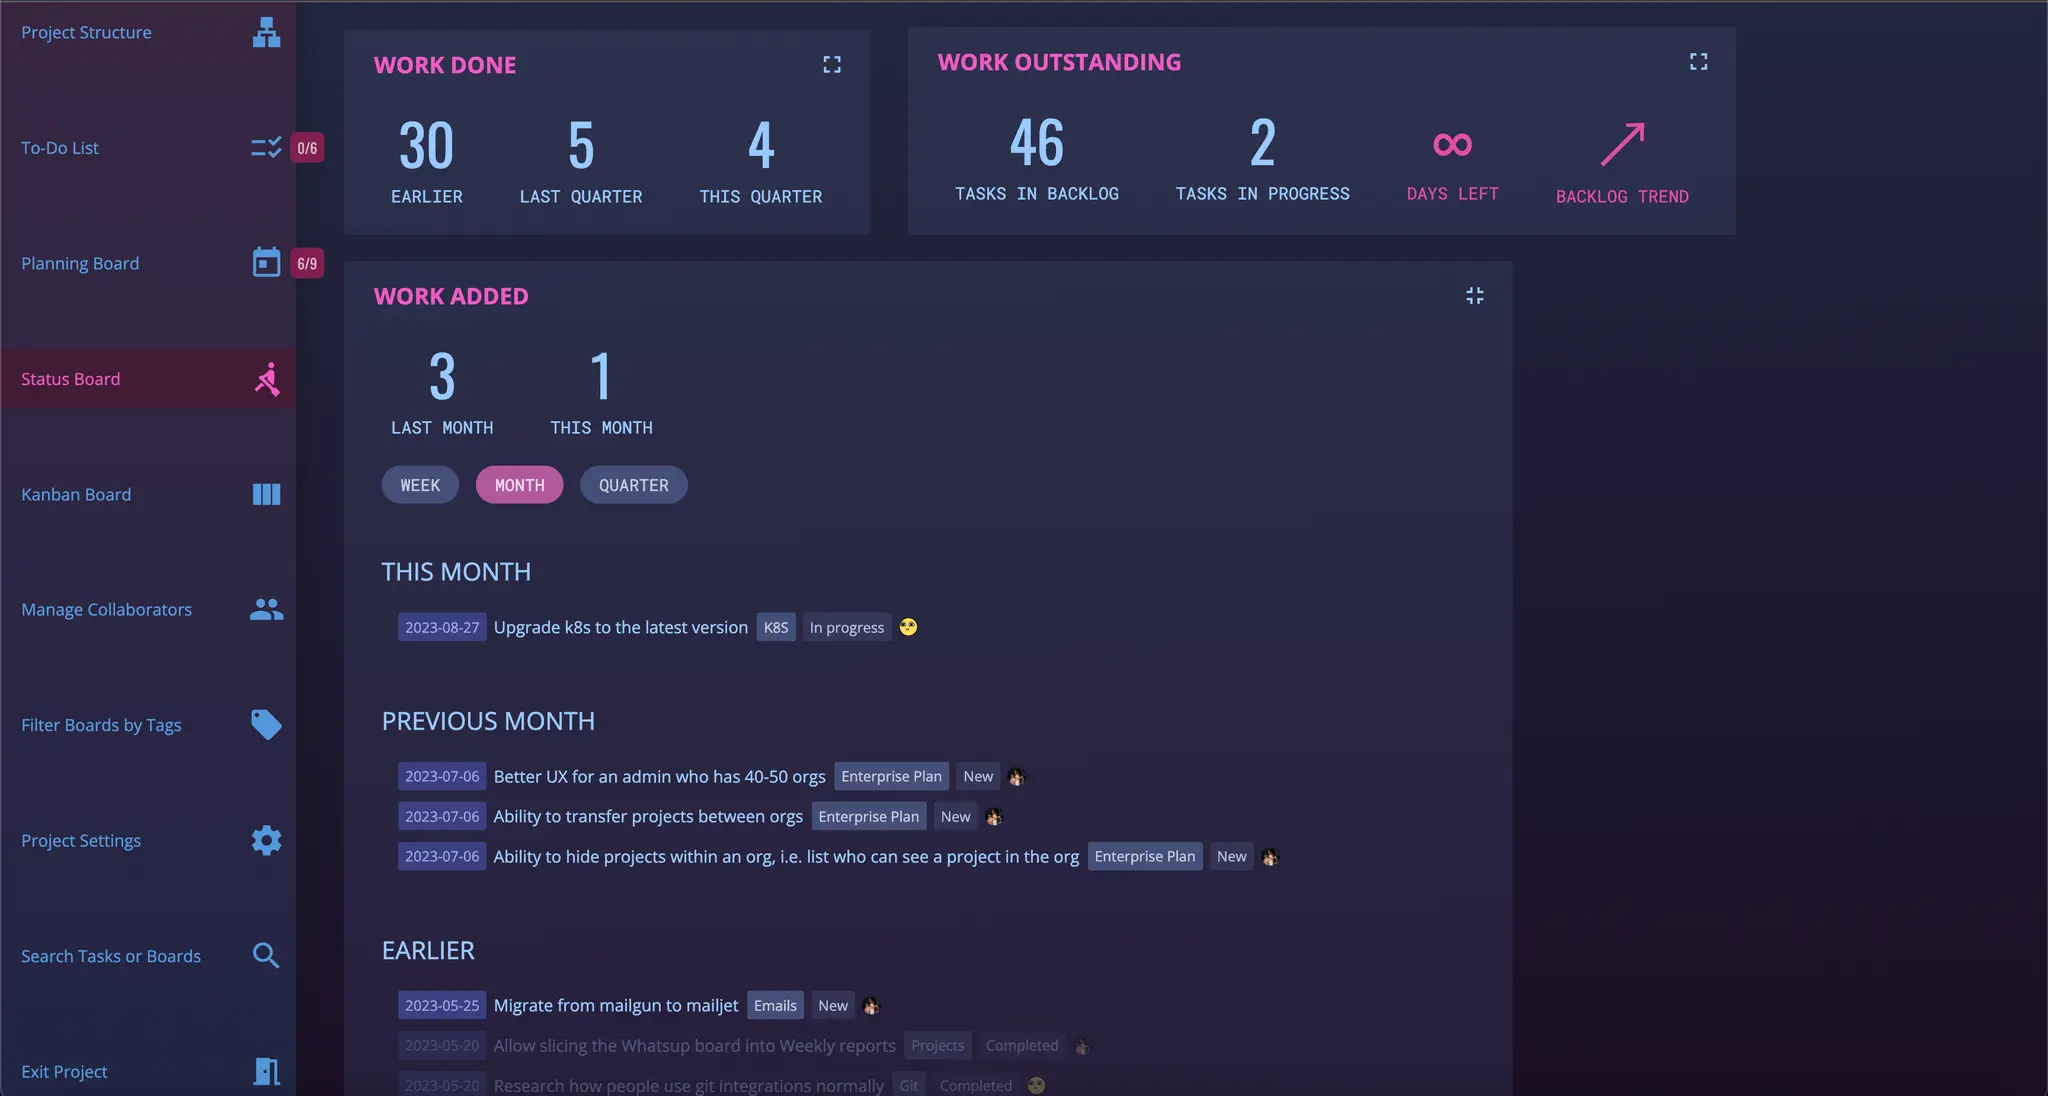
Status Board (work added)
You don't need to set anything up to have these reports. Weekly, Monthly and Quarterly reports are just one click away!
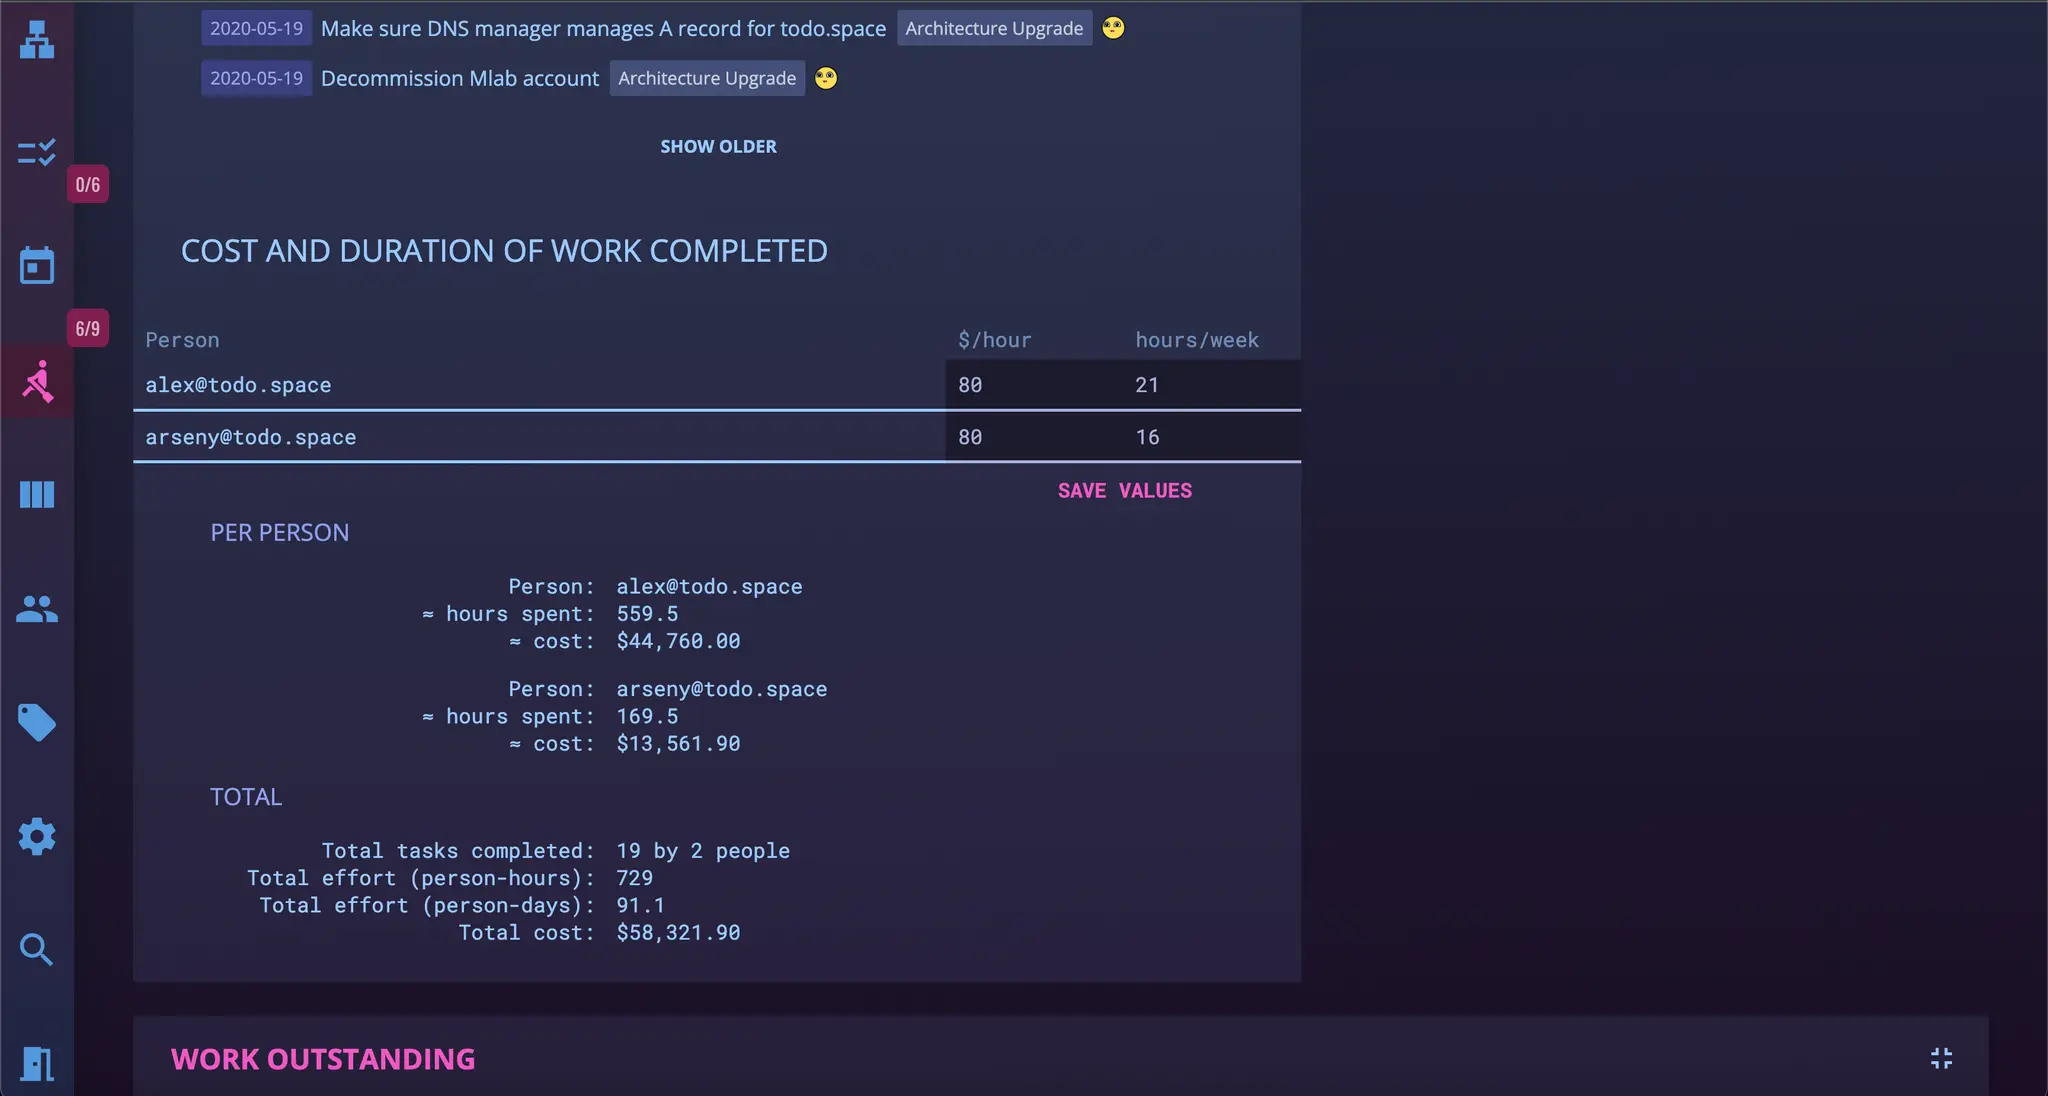
Status Board (work done)
Work done is more than just a list of things done, it's also numbers — of hours and dollars spent on it. For the whole project or its parts, and he best part — nobody has to do timesheets!
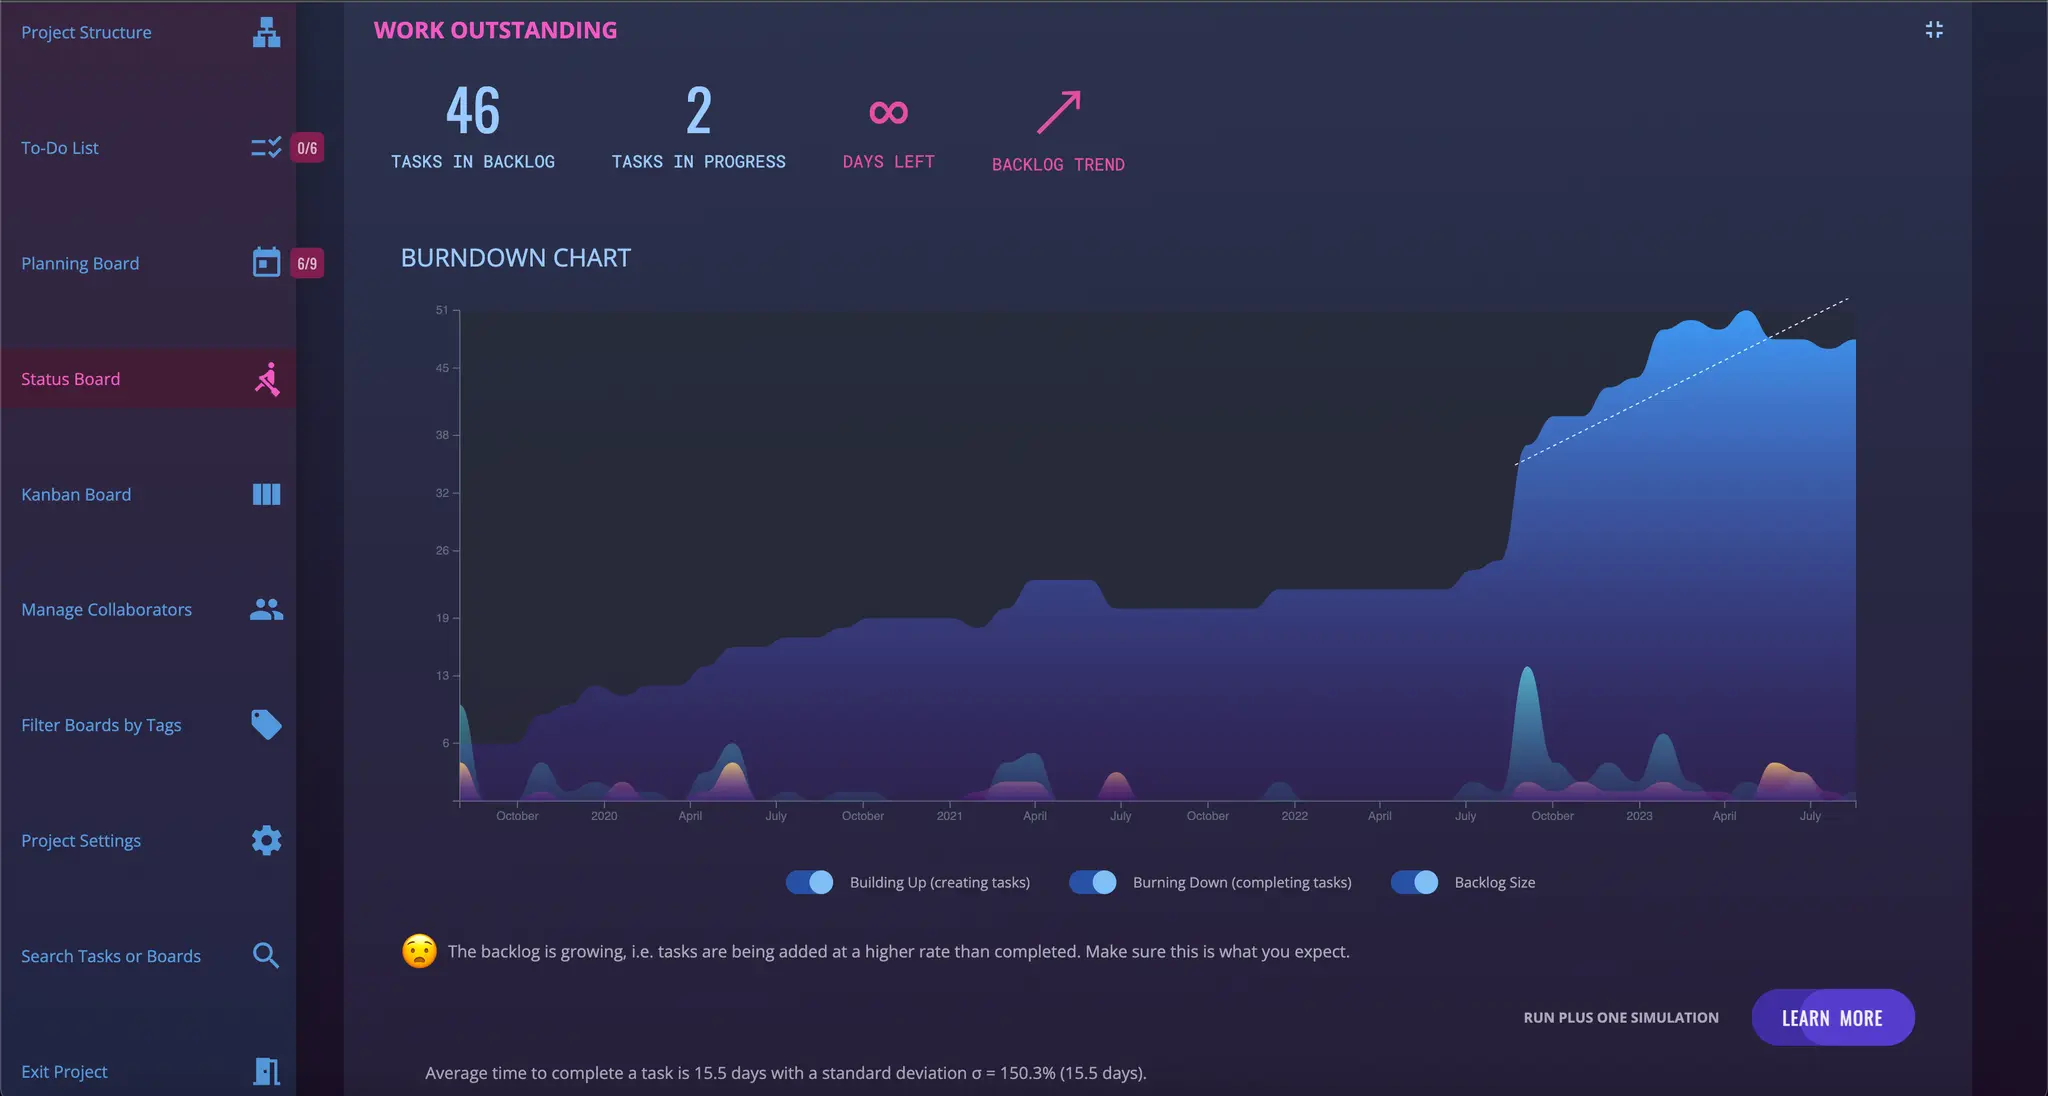
Status Board (work outstanding)
Track the backlog size over time and correlate it with new work added. There is also a Plus-One Simulator to imagine how the chart would look like if you hired one more person.
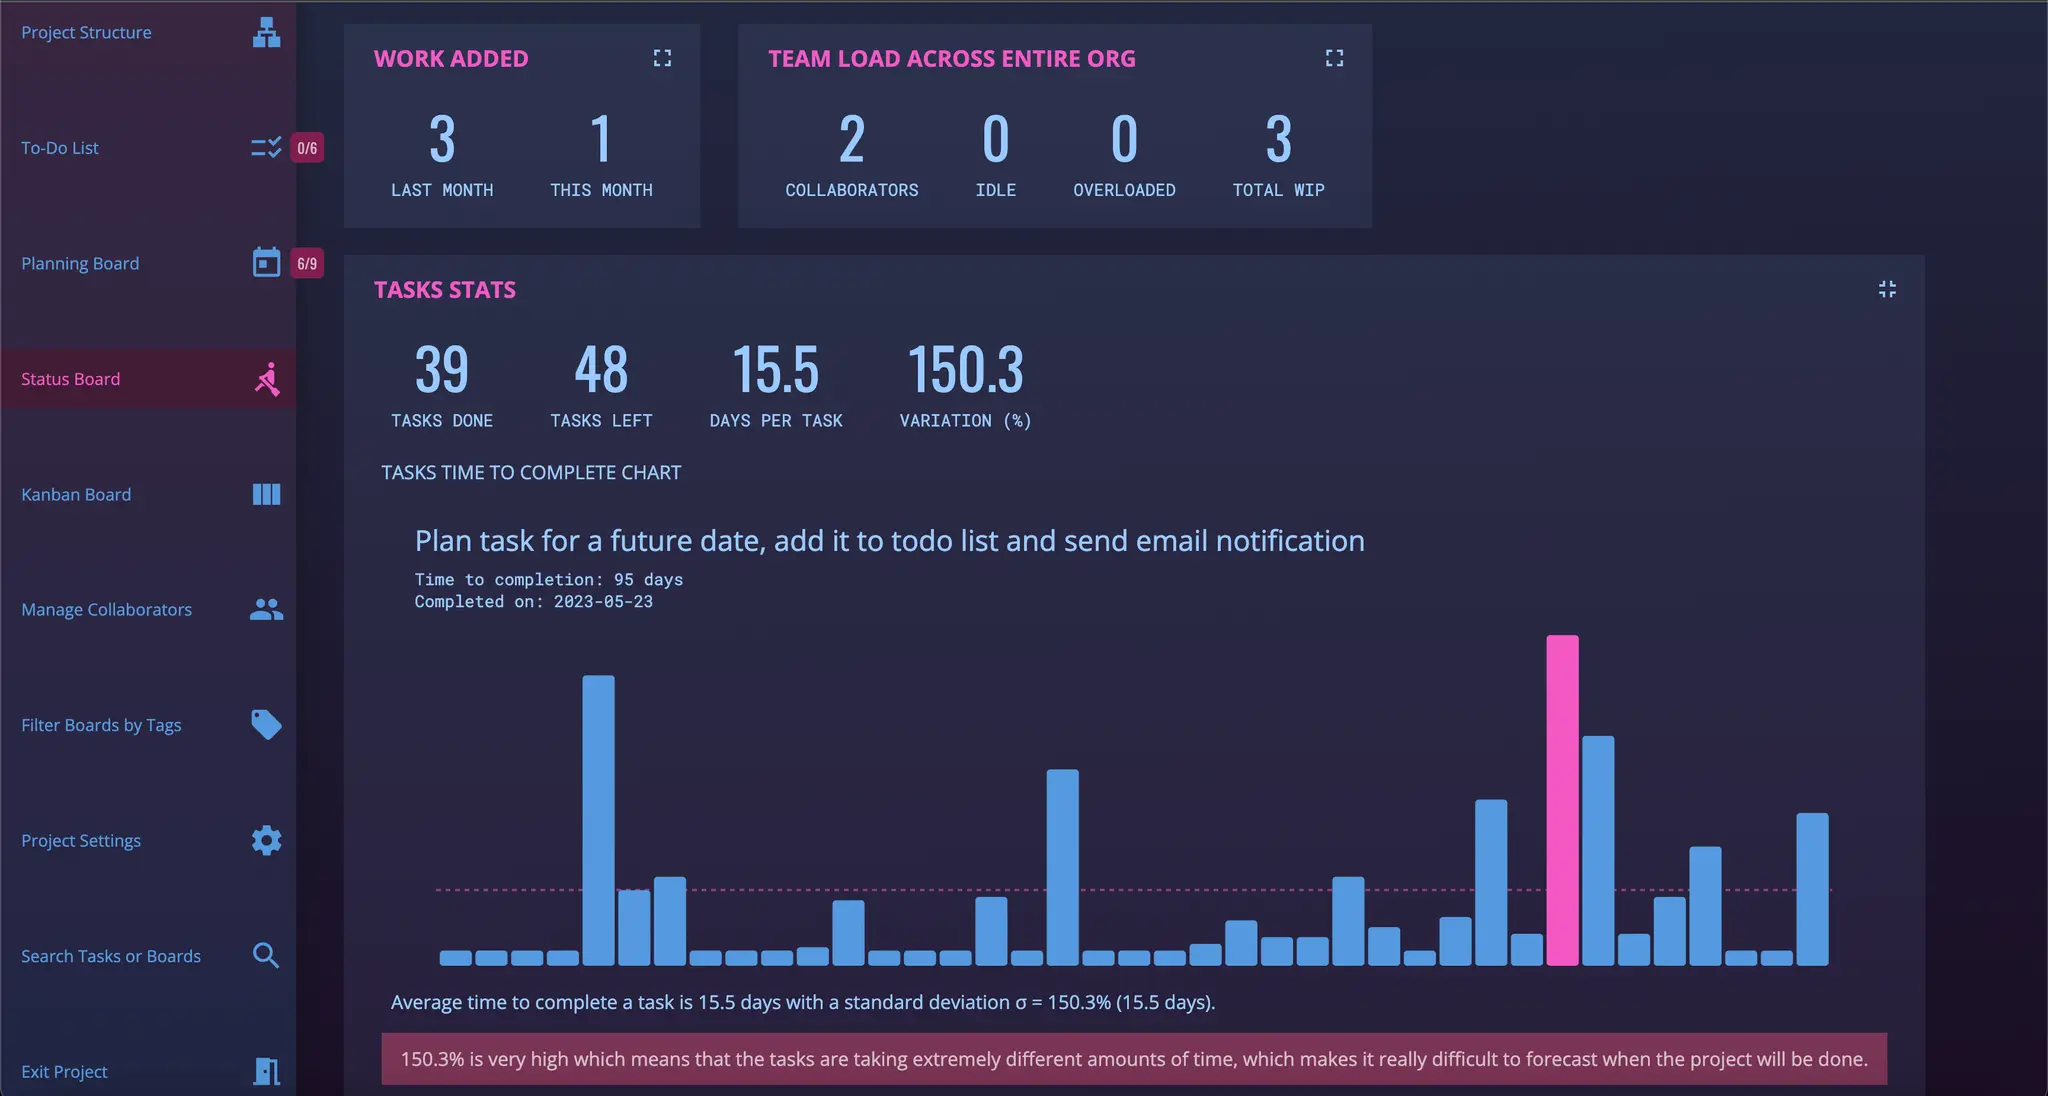
Status Board (task stats)
Task stats and variation are essential for tracking outliers and special causes for team productivity troubleshooting. Reducing variation improves the accuracy of forecasts.
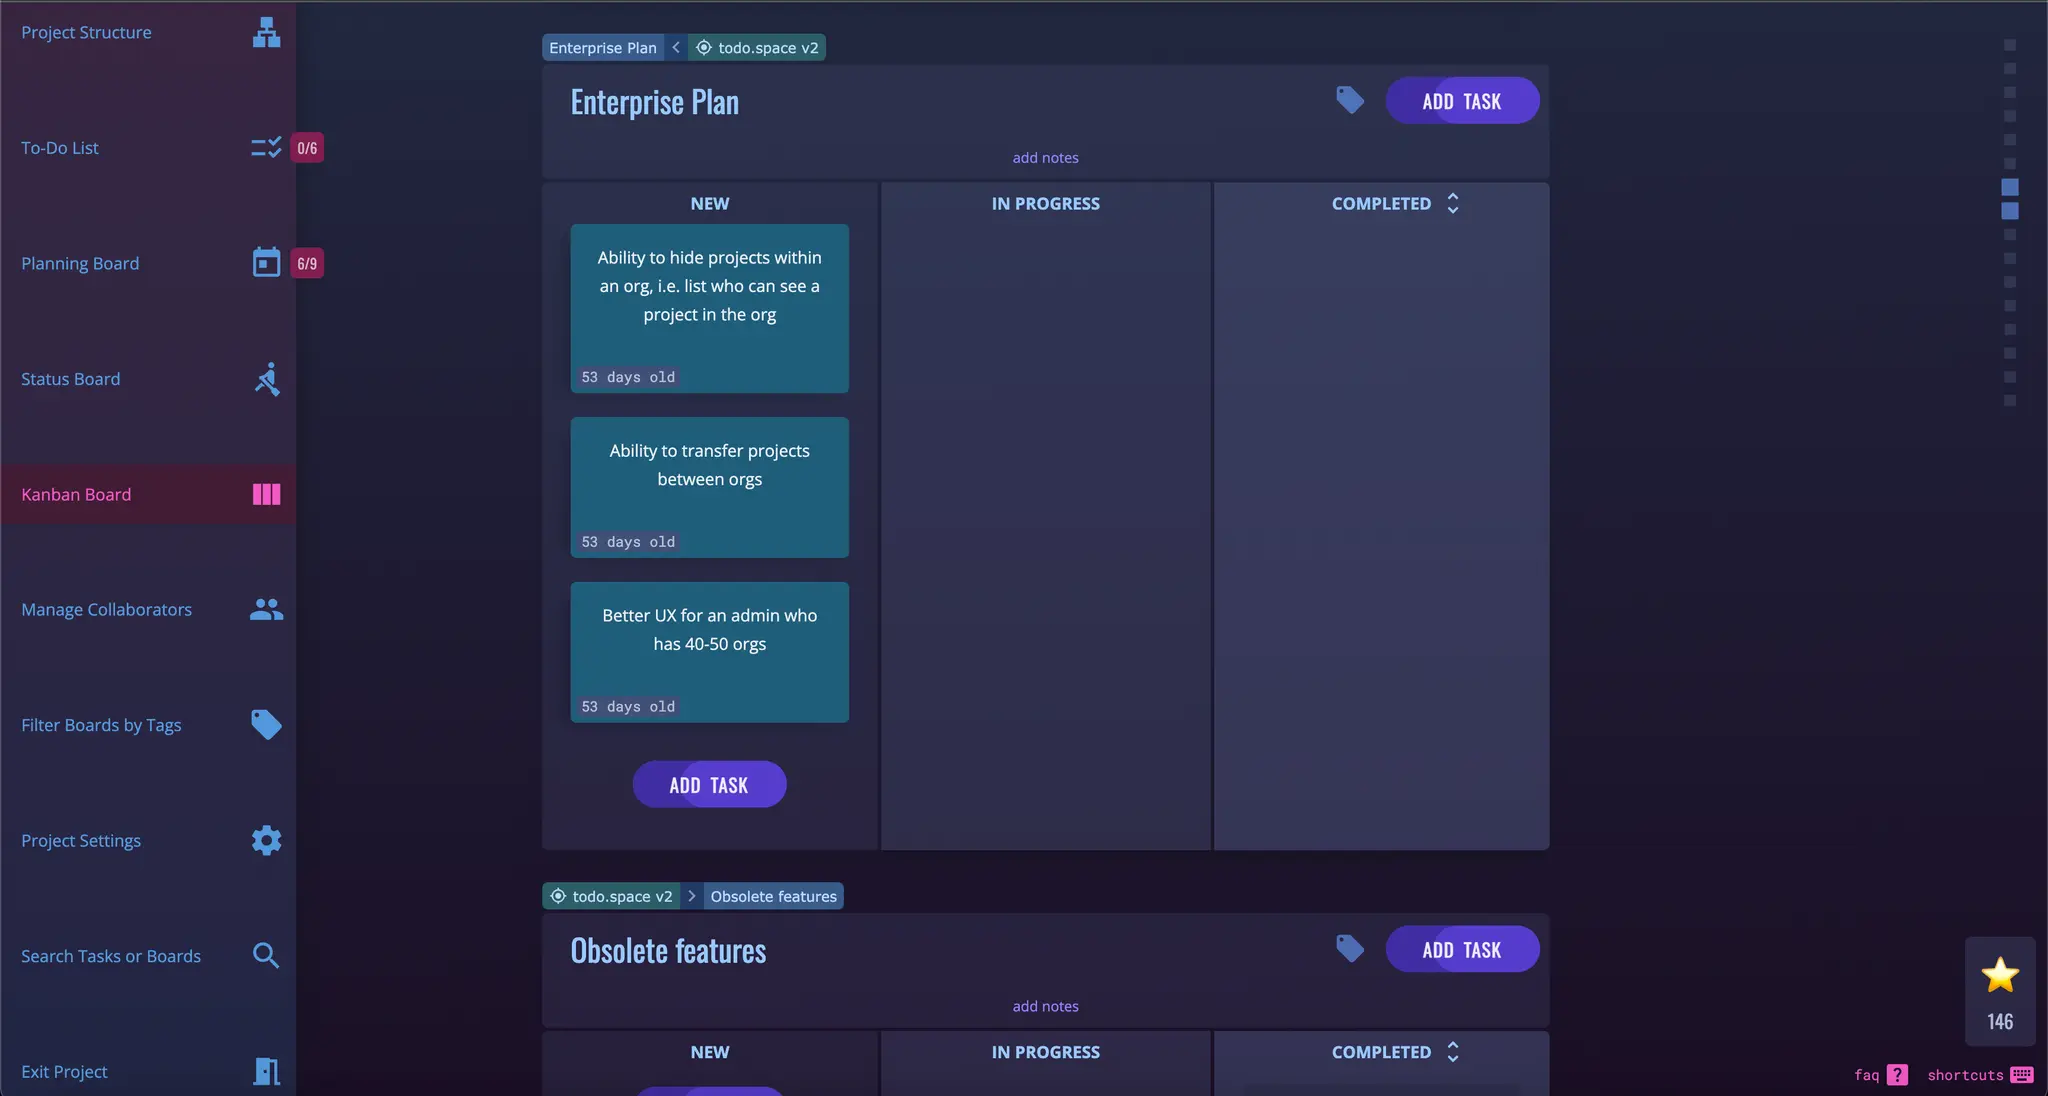
Kanban Board
A Kanban board is a visual tool to track your outstanding, in progress and completed tasks. One Kanban board represents one deliverable — don't throw everything at one board, create new boards as needed.
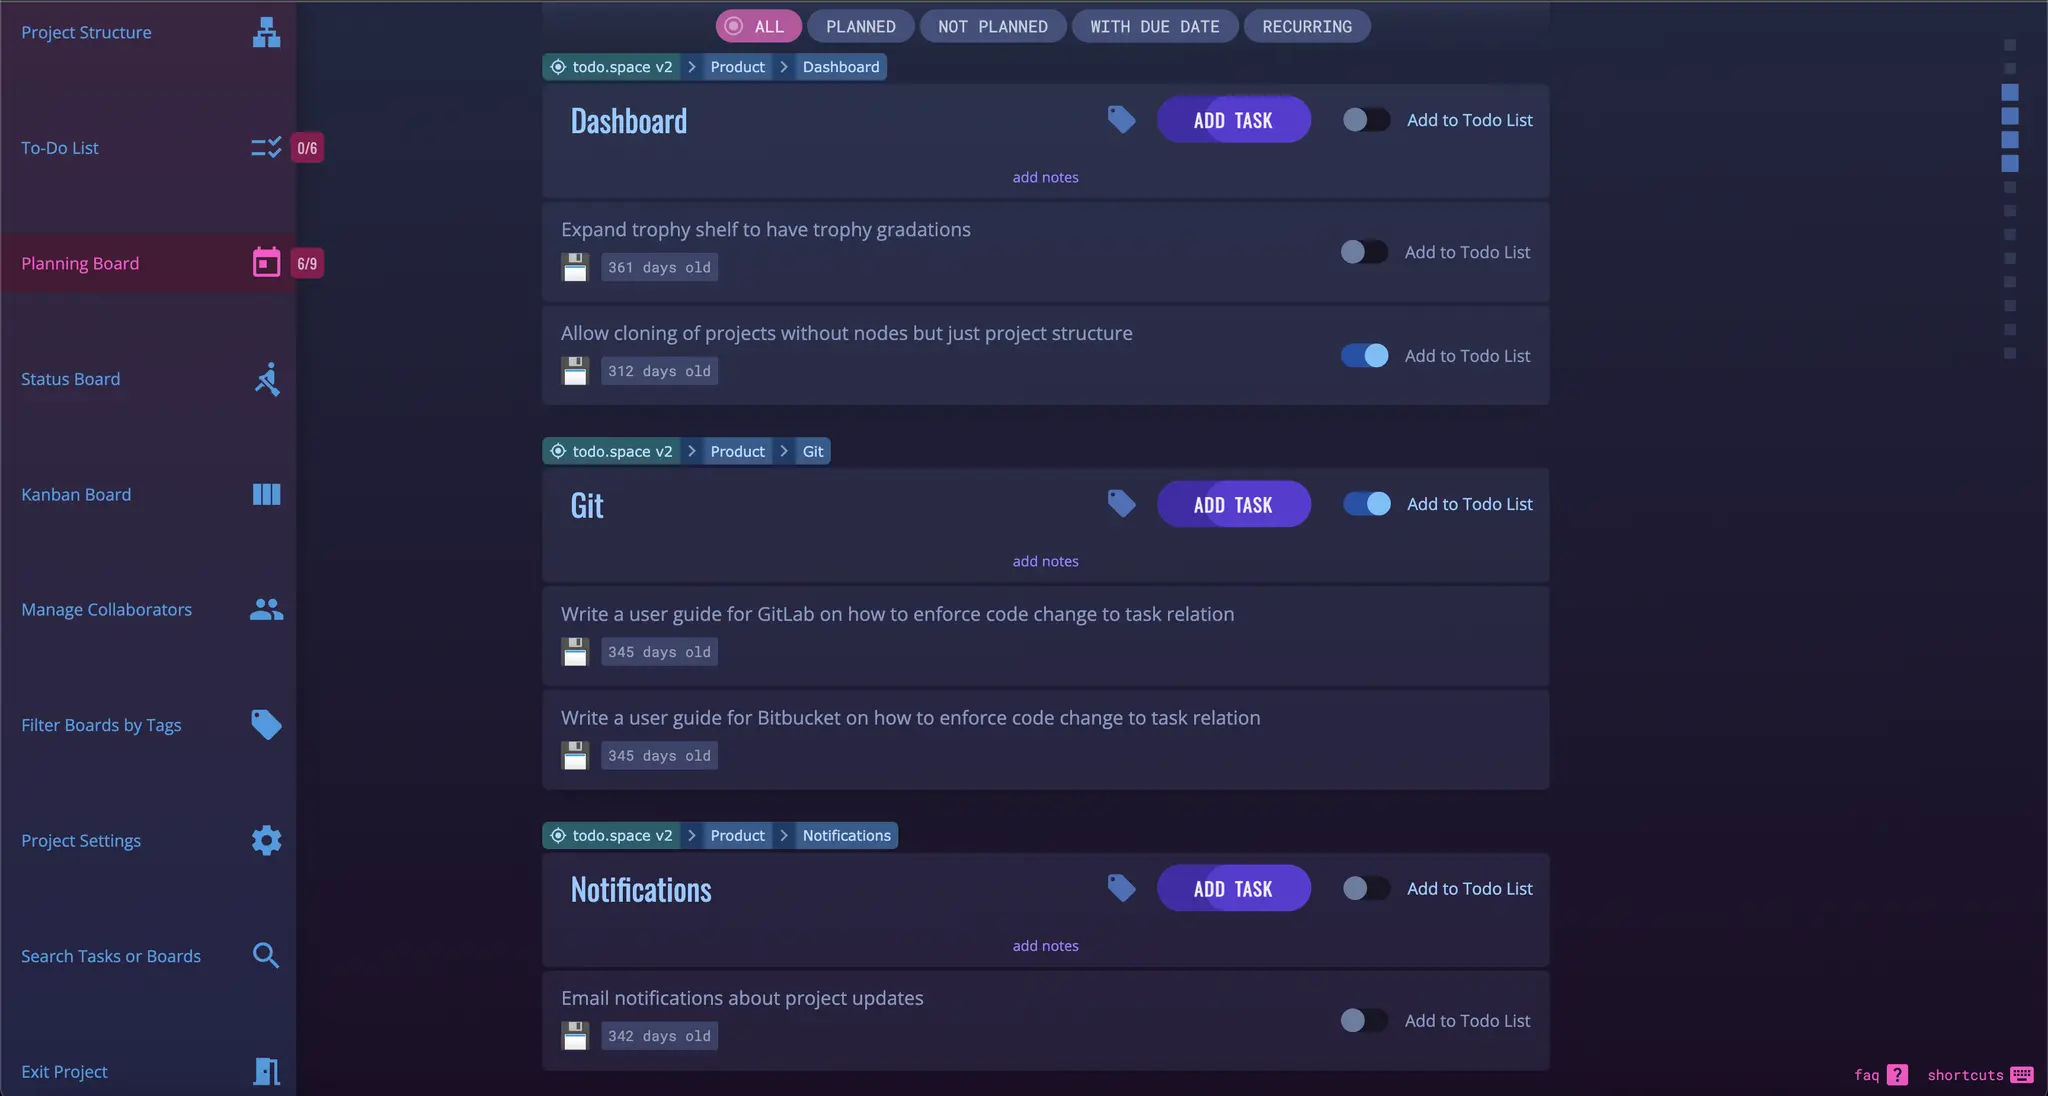
Planning Board
Here you decide what tasks to work on next and add them the To-Do List. Planning capacity is determined by the number of collaborators in the project — more people, more tasks to plan
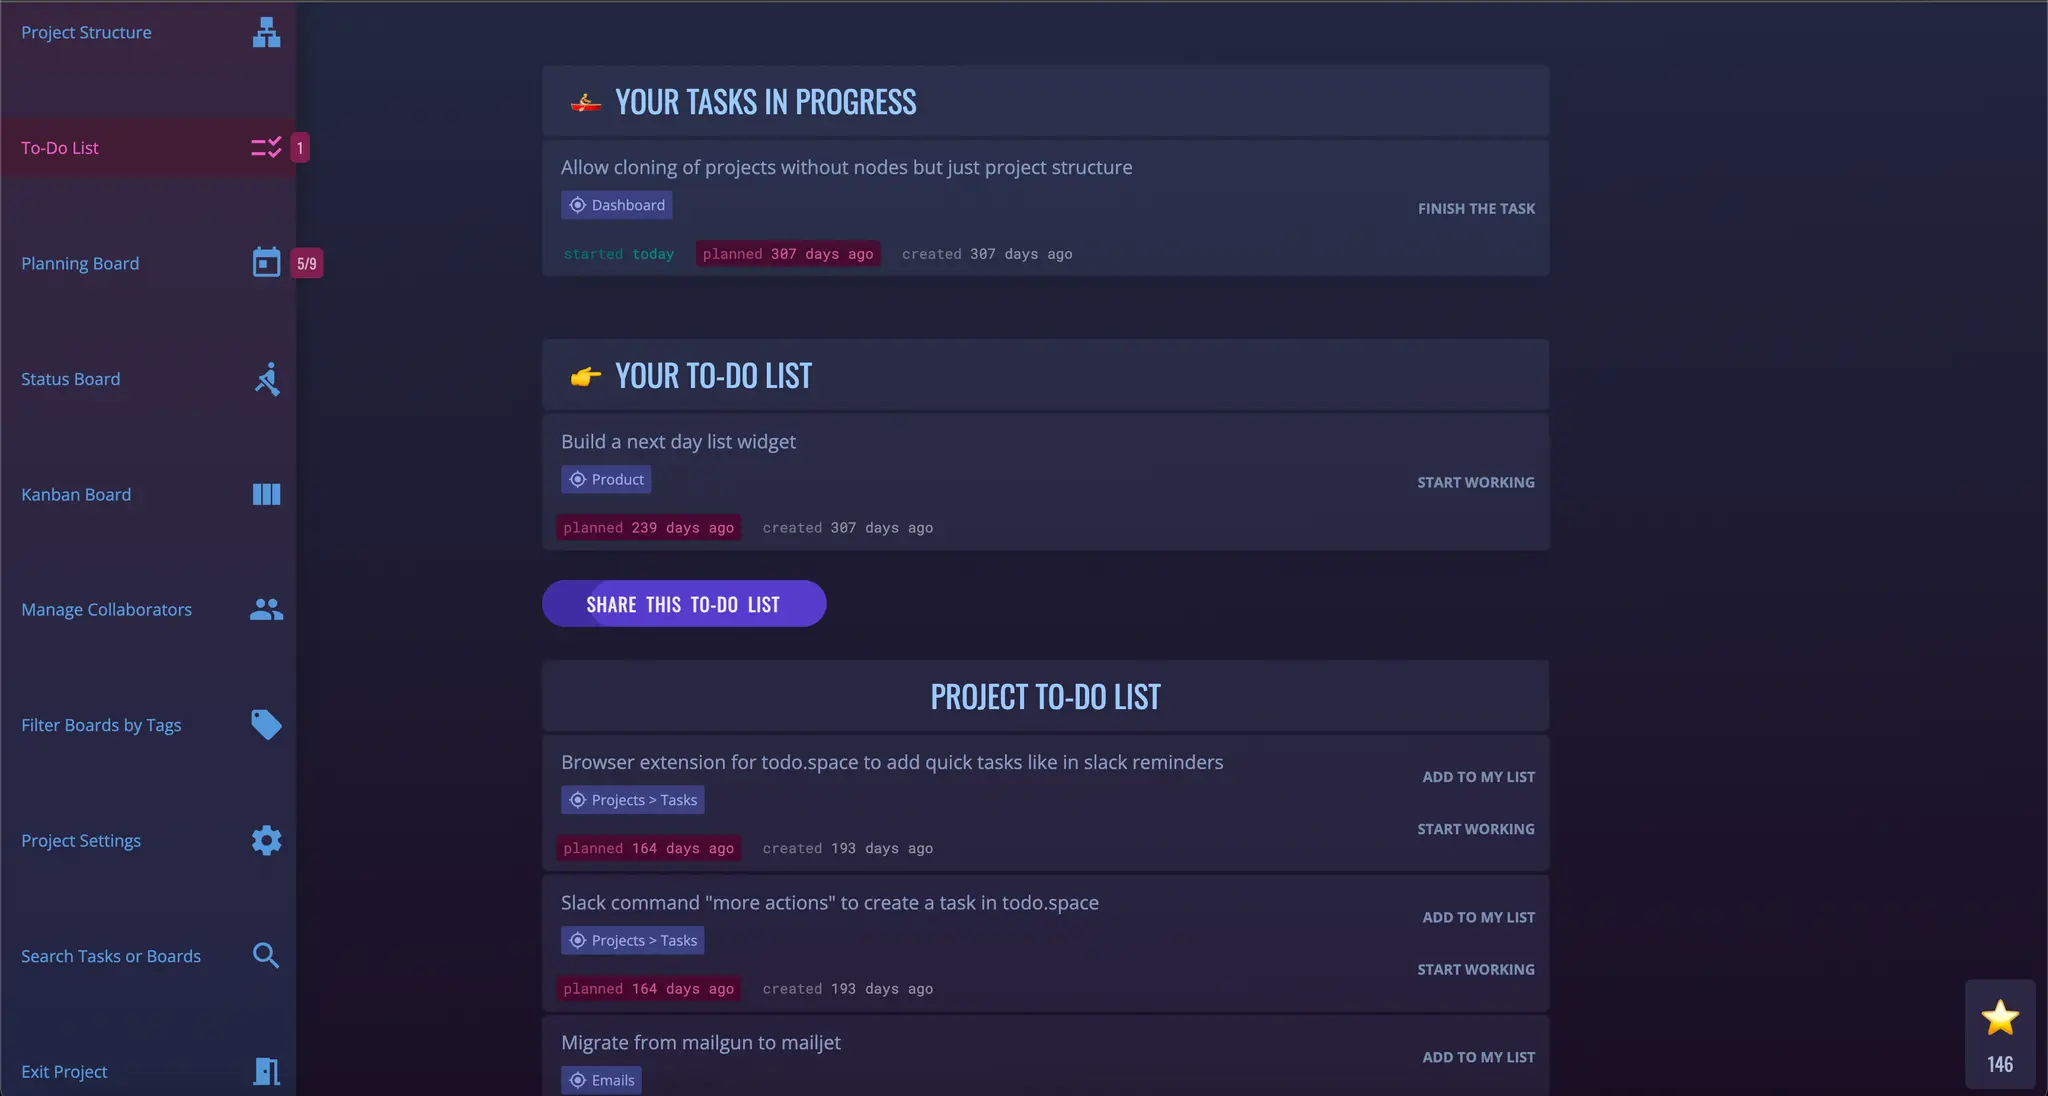
To-Do List
After you planned all tasks on the Planning Board, the team can see what to work on next in the To-Do List. Here, they can also take tasks from the project list and add to their own lists
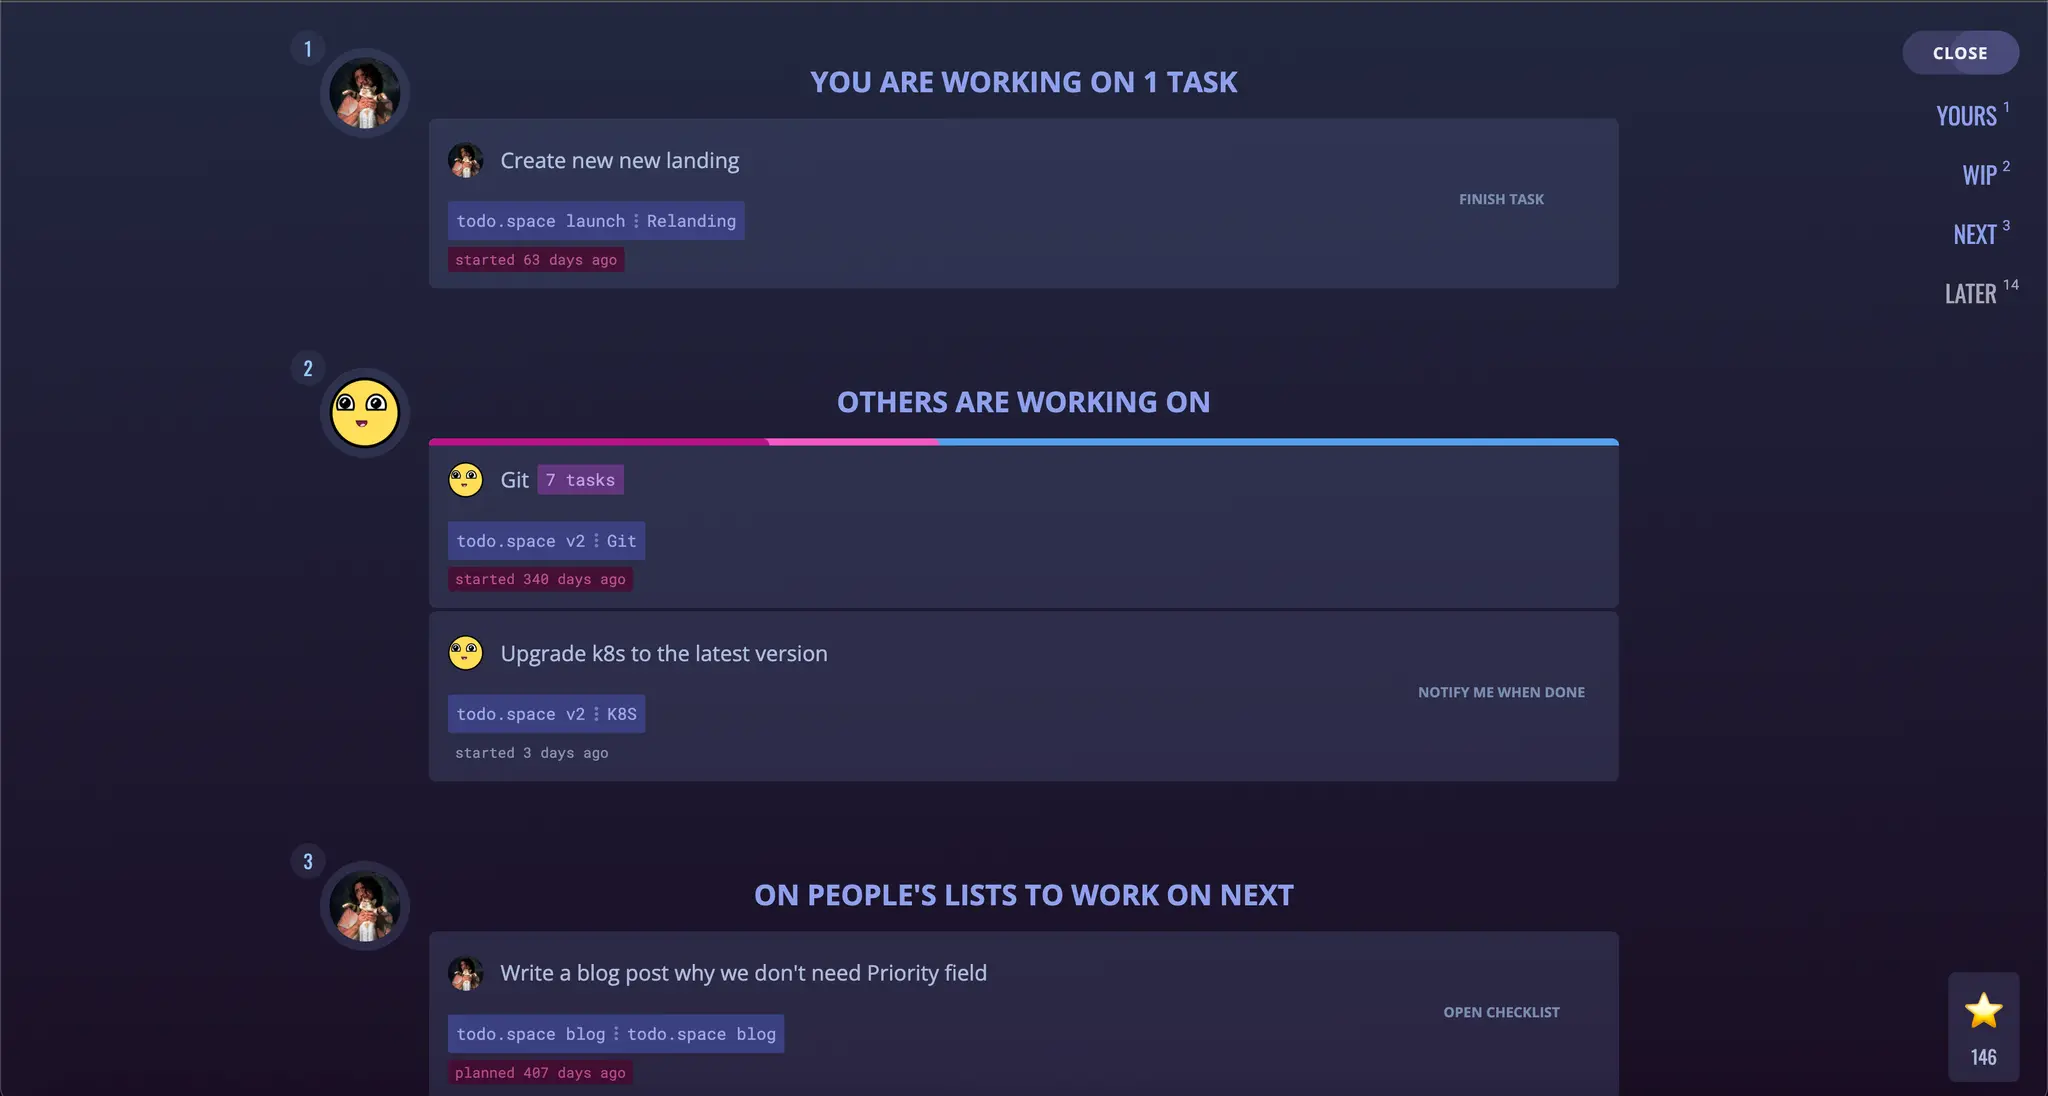
One To-Do List for Multiple Projects
Imagine you work on three projects. To stay organized — you need one to-do list, not three. In this screenshot, you can see a single to-do list showing tasks from three projects: v2, launch, blog.
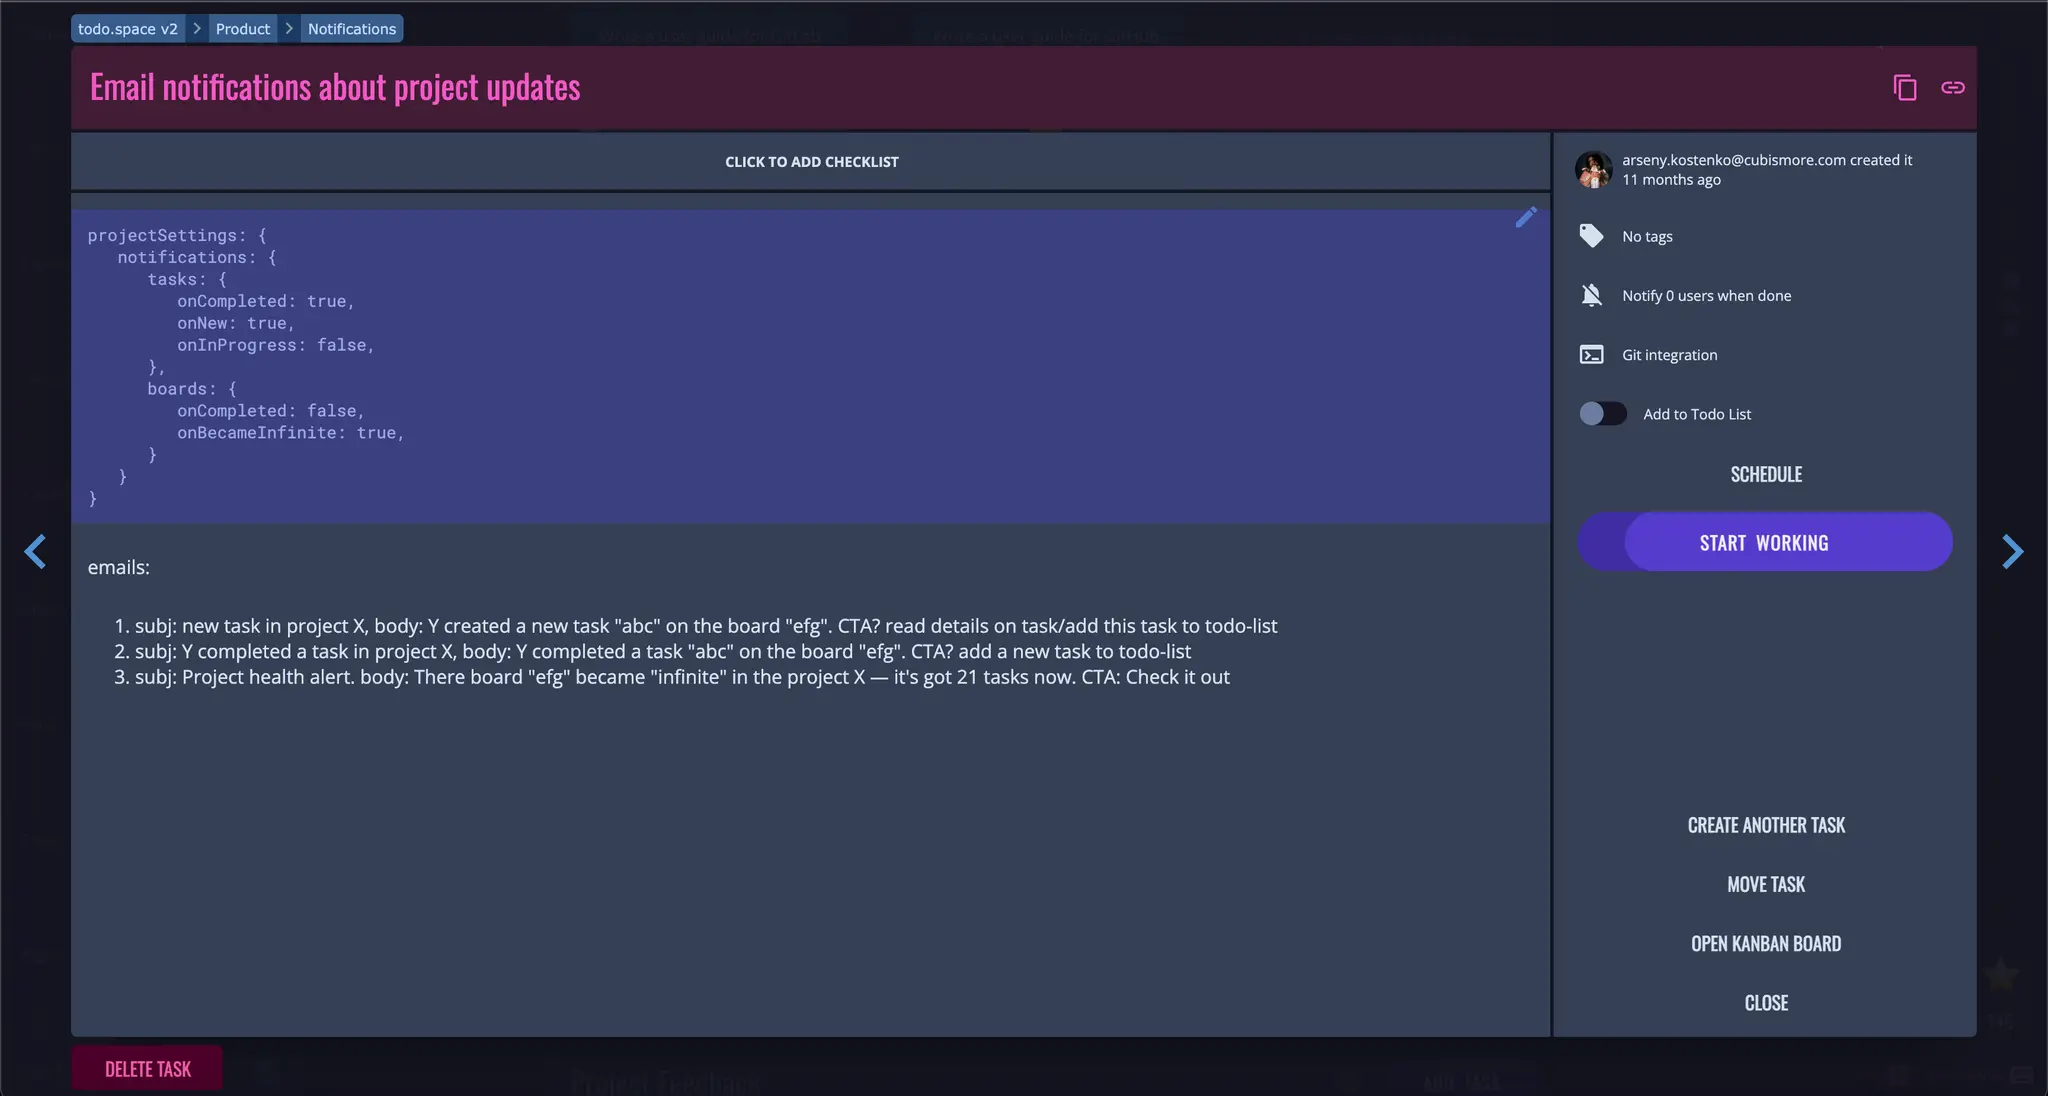
Task Editor
Git integration, recurring and scheduled tasks, tags, completion notifications and checklists are easily accessible in the Task Editor.
START FREE TRIALNO CREDIT CARD REQUIRED
Ready to know what, at all times, is happening in your projects and much do they really cost?